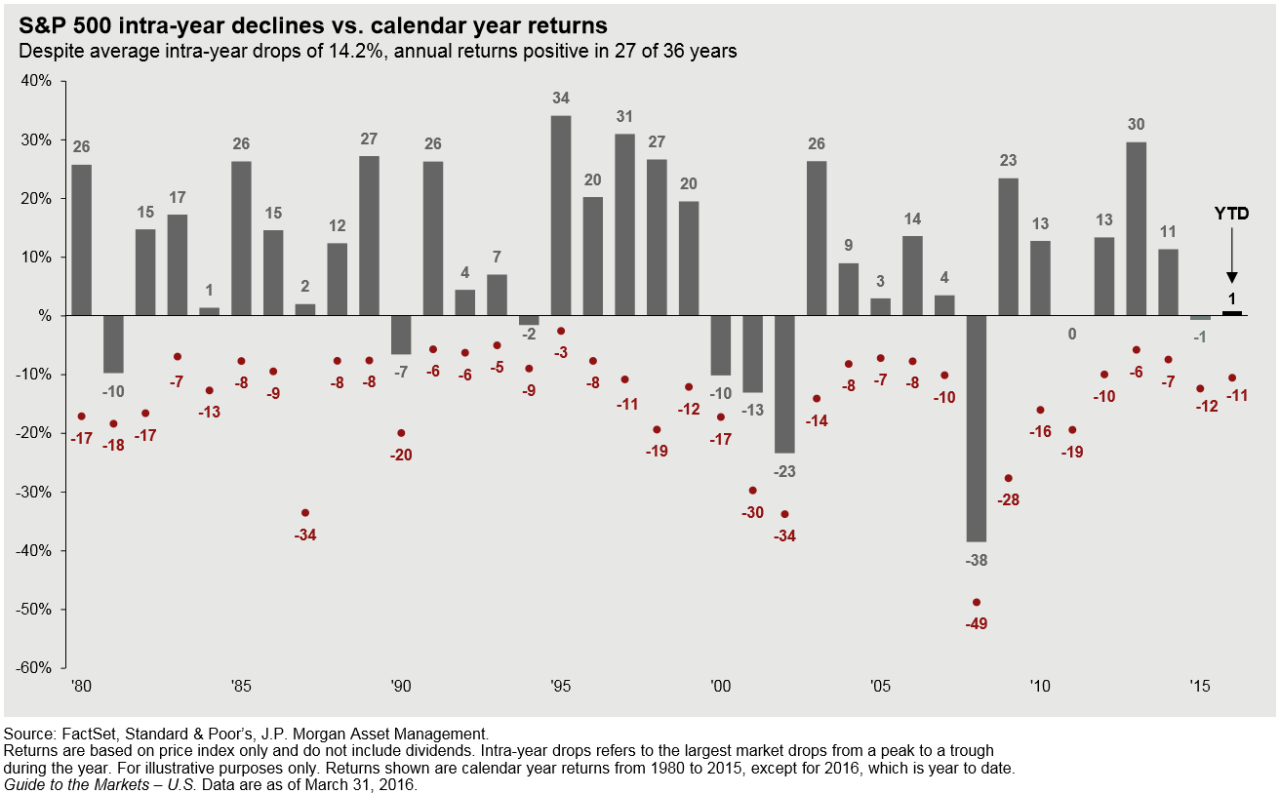
The graph above is very powerful stuff. It shows S&P 500 calendar year returns and the biggest intra-year declines that occurred. Notice that 27 of the last 36 calendar years had positive returns. Notice also that in many of those positive calendar years there were very big intra-year drops. This helps to illustrate that volatility is normal, and market corrections in the midst of a bull market is normal.
Written April 20th, 2016